This paper is available on arxiv under CC 4.0 license.
Authors:
(1) Z. Jennings, Astrophysics Group, Keele University, Staffordshire, ST5 5BG, UK (E-mail: [email protected]);
(2) J. Southworth, Astrophysics Group, Keele University, Staffordshire, ST5 5BG, UK;
(3) K. Pavlovski, Department of Physics, Faculty of Science, University of Zagreb, 10000 Zagreb, Croatia;
(4) T. Van Reeth, Institute of Astronomy, KU Leuven, Celestijnenlaan 200D, B-3001 Leuven, Belgium.
Table of Links
- Abstract and Intro
- Observation
- Orbital Ephemeris
- Radial Velocity Analysis
- Spectral Analysis
- Analysis of the Light Curve
- Physical Properties
- Asteroseismic Analysis
- Discussion
- Conclusion, Data Availability, Acknowledgments, and References
- Appendix A: Ephemeris Determination
- Appendix B: Iteratively Prewhitened Frequencies
- Appendix C: Detected Tidally Perturbed Pulsations
9 DISCUSSION
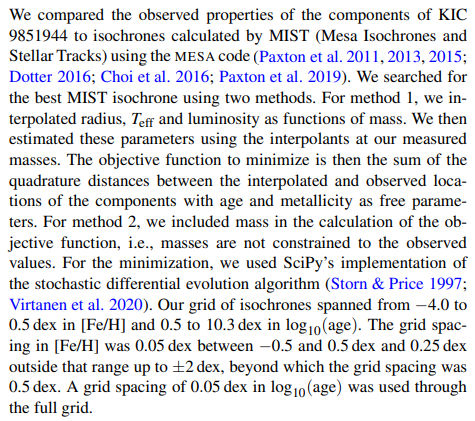
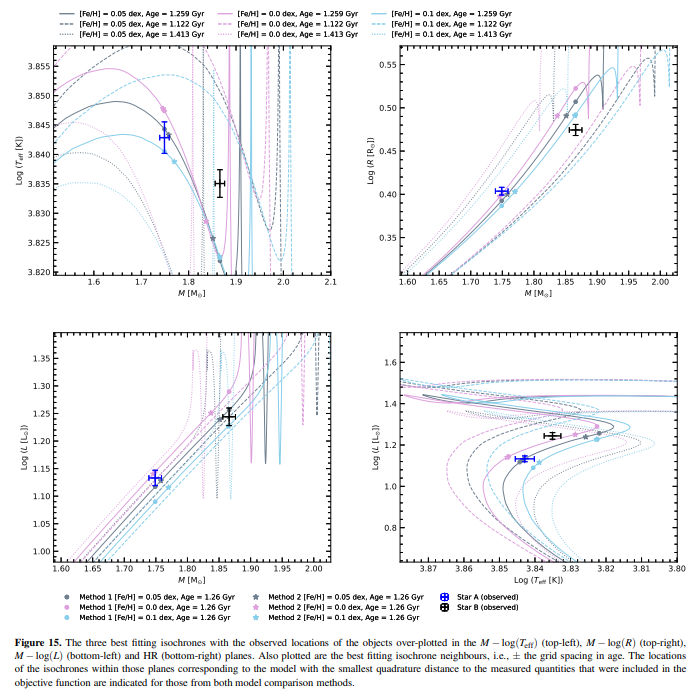
After the best matching coeval isochrone was found, we removed the corresponding metallicity value from our isochrone grid and repeated the procedure to explore the effect of varying [Fe/H] on the predicted age of the system. We did this twice, leading to first, second, and third best matching coeval isochrones, each corresponding to a different metallicity. For method 1, the metallicity values of the first, second and third best matching isochrones were 0.05, 0.1 and 0.0 dex, respectively. For method 2, these values correspond to 0.05, 0.0 and 0.1 dex, i.e., the same set, except the second and third best matches are swapped. In all cases, the predicted age of the system is 1.259 ± 0.073 Gyr. The error on this age estimate is taken to be half the average grid spacing either side of the best fitting isochrone.
![Table 7. Model parameters of the best fitting isochrone with [Fe/H] = 0.05 dex and an age of 1.259 ± 0.073 Gyr. The results obtained from both comparison methods are given. Also given are the differences ∆ between the observations and model for each parameter; we quote this difference in units of the uncertainty associated to the observations in brackets.](https://cdn.hackernoon.com/images/fWZa4tUiBGemnqQfBGgCPf9594N2-jw93v7y.png)
We note that this age estimation is in excellent agreement with the estimation by Guo et al. (2016) of 1.25 Gyr.
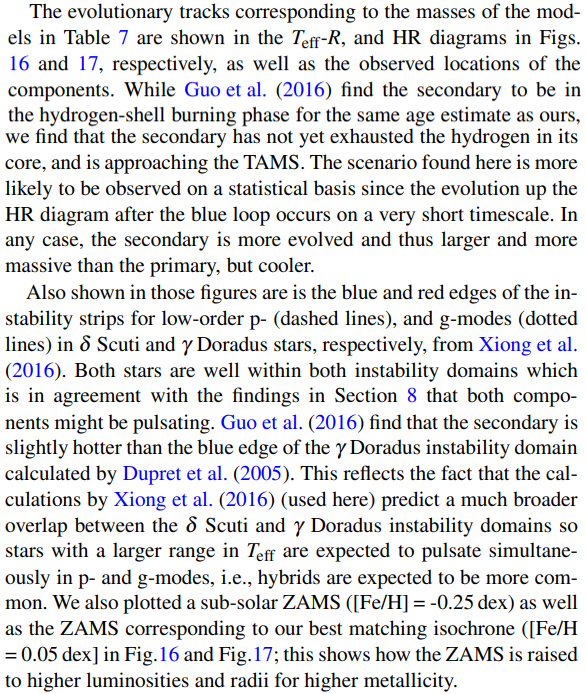
A possible explanation is that the secondary star is approaching the terminal age main sequence (TAMS), i.e., an evolved stage where the sensitivity of the models increases. Thus, a full evolutionary modelling analysis, such as that carried out by Guo et al. (2016), might yield better model predictions because metallicity and other parameters relating to, e.g., overshooting, are included as free parameters so the model is more flexible. This would also provide the means for a more detailed discussion of model comparison with observations but is beyond the scope of this paper. Here, we simply searched in grids of pre-computed models, which are limited by the size of the grid steps in metallicity and age, as well as fixed input physics, to estimate the age of the system. The parameter ranges that the isochrone neighbours span in the planes shown in Fig.15 (i.e., about twice the uncertainty), and the agreement with the value determined by Guo et al. (2016), is evidence that this age estimation is accurate.
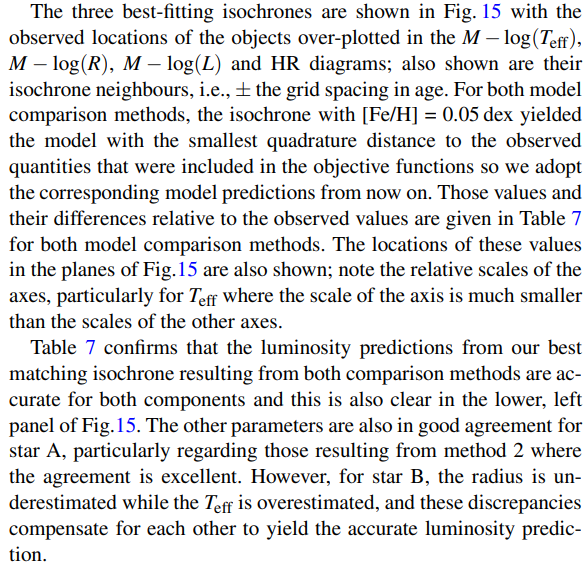
We present the results previously derived by Guo et al. (2016) in Table 8. The 13 spectroscopic observations that the previous authors used to derive their RVs and atmospheric parameters have resolutions of R = 6000. While it was already discussed in section 5.1 that our atmospheric parameters agree with those derived by Guo et al. (2016), the higher resolution (R = 60000) of the spectra, and larger number of observations (33) used in this work yielded a much higher quality RV curve. This is reflected by comparing the reported masses between the two studies; the precision in the mass estimates by Guo et al. (2016) are 4.0% and 3.9% for the primary and secondary, respectively, while we attain precisions of 0.57% and 0.59%. The two sets of mass measurements agree to within 0.2σ for MA and 1.1σ for MB. In contrast, our radius measurements differ from those of Guo et al. (2016) by 6.6σ for star A and 3.5σ for star B. However, Guo et al. (2016) note the discrepancy between their values for the radius ratio derived from two spectroscopic methods (k = 1.22 ± 0.05 and k = 1.27 ± 0.29) and the value derived from their light curve modelling (1.41 ± 0.018), where they tentatively adopt the radii associated to the latter. The radius ratio derived here agrees with the values derived by Guo et al. (2016) using their spectroscopic methods within 0.8 σ and 0.3 σ, but shows the same discrepancy compared to the value derived from their light curve modelling, for which Guo et al. (2016) note there exists a family of comparable solutions due to the partial nature of the eclipses.
We have assumed a circularised and synchronized orbit for KIC 9851944 because our RV- and light-curve solutions were consistent with a circular orbit, and the values for the component of the synchronous velocity along our line of site are in excellent agreement with the values for vsini derived in section 5.1 (see Table 3). Further justification was provided by Guo et al. (2016) where they examined the eclipse times by Conroy et al. (2014) and Gies et al. (2015), finding that the median deviation of the phase difference between the primary and secondary eclipses from that of a circular orbit suggests e ≥ 0.0001. Furthermore, the circularization timescale for a binary system like KIC 9851944 is 600 Myr, and the synchronization timescale is an order of magnitude shorter (Zahn 1977; Khaliullin & Khaliullina 2010; Guo et al. 2016); these timescales are shorter than the age of the system reported by both studies.
Our estimations of the near-core and surface rotations reported in section 5.1 and 8 suggest KIC 9851944 is rotating rigidly and synage. The locations of the isochrones within those planes corresponding to the model with the smallest quadrature distance to the measured quantities that were included in the objective function are indicated for those from both model comparison methods. chronously. This is similar to the findings by e.g. Guo et al. (2017); Guo & Li (2019), that the short-period EBs KIC 9592855 and KIC 7385478 both contain a γ Doradus pulsator that is tidally synchronised at the surface as well as at the near-core regions.
In contrast to the above, our detection of the orbital harmonic frequency comb for KIC 9851944 either suggests asynchronous rotation or a non-zero eccentricity that has not been detected due to observational error because these can be indicative of tidally excited oscillations, It is unclear whether the very small value for the lower limit on the eccentricity, i.e., e > 0.0001, reported above for this system would be enough to induce tidal excitation of modes at the amplitudes observed here.
The pulsation analysis here complements the study by Guo et al. (2016) who report splittings to some of the pulsation modes. We confirm the detection of tidally split multiplets, and explain their origin; we present evidence to suggest that these are due to pertubations to the pulsation mode cavaties, i.e., tidally perturbed pulsations, by investigating their phase and amplitude dependencies with orbital phase. Guo et al. (2016) attempted to interpret the modes by comparing the observations with theoretically computed frequencies, from which they concluded that the observations can be explained by low-order p modes in the primary and the secondary, or the g mode and mixed modes of the secondary (Guo et al. 2016). We confirm that some of the p modes belong to the primary, and others could belong to either the primary or the secondary from modulation of the amplitudes during eclipses. Our evidence suggests the primary is the hybrid, and this is because the saw-tooth-like “glitch“ in pulsation phase of the tidally perturbed g mode (see Fig. C1) can only be explained if the pulsation belongs to the primary (Van Reeth et al. 2022, 2023). Guo et al. (2016) report that mode identification was inconclusive, reflecting the difficulty in identifying the p-modes in δ Scuti stars.
