This paper is available on arxiv under CC 4.0 license.
Authors:
(1) Dylan Warman, School of Computing, Charles Sturt University;
(2) Muhammad Ashad Kabir, School of Computing, Mathematics,.
Table of Links
- Abstract & Introduction
- Related Works
- Materials and Methods
- Results and Discussion
- Conclusion & References
IV. RESULTS AND DISCUSSION
A. ML Models Evaluation
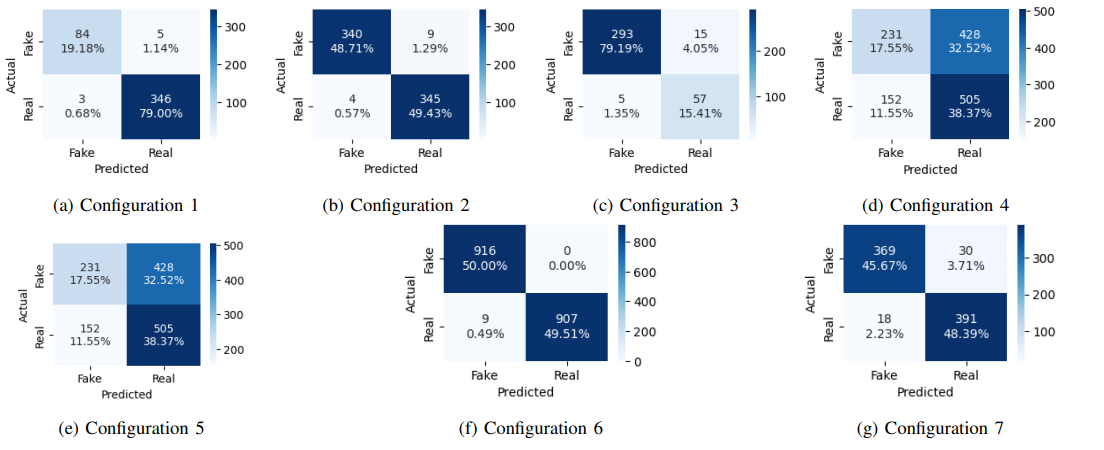
The results of running the three models (BERT, Bi-LSTM, and CNN) for seven configurations (C1 to C7) are presented in Table II. For configuration C1, all three models consistently perform well, achieving the highest average and displaying the most consistent scores among all the tests. However, it is important to consider whether this high accuracy might be influenced by the imbalanced nature of the dataset. This consideration is quickly addressed by examining Fig. 3a, which displays the BERT confusion matrix. Here, only five fake labels were misclassified compared to the three from the real set. This suggests that the dataset’s imbalanced nature is unlikely to have significantly influenced the accuracy. Instead, it appears that the dataset contains well-separated data that the models were able to effectively distinguish.

For configuration C2, it is worth noting that while BERT maintains a consistent score, with only a minor drop of 0.03%, both the Bi-LSTM and CNN models experience significant decreases in accuracy, exceeding 10%. This drop in accuracy suggests that oversampling is ineffective for this dataset, and it indicates that BERT is more resilient to the challenges posed by oversampled data. Fig. 3b displays the relationship between predicted labels and true labels, which closely resembles that of C1. This further confirms that the accuracy achieved in C1 was not solely due to the imbalanced dataset. Despite the slight reduction in accuracy, this configuration strengthens the case that BERT is the optimal model for this particular scenario.
For configuration C3, we observe lower overall accuracy compared to C1. This suggests that the examples in this dataset are more challenging to distinguish than those in the first dataset. More challenging data can be both a positive and negative aspect. On the one hand, it demonstrates that the algorithm can still differentiate between the examples to a significant extent. On the other hand, the lower accuracy indicates that the algorithms face greater difficulty in establishing connections between textual elements. Additionally, when we examine Fig. 3c, we notice that the optimal algorithm’s accuracy varies mainly when classifying real data. This variance can be attributed to the overall scarcity of real news in this dataset, resulting in a 20.83% misclassification rate for real news.
Interestingly, the trend observed in C2 continues in C4, with a significant decrease in accuracy across all three models. BERT experiences the most substantial accuracy drop when compared to C3, which can be partly attributed to its higher initial accuracy. Across all three models, the average drop in accuracy is 20.53%, a sharp increase compared to the average drop of 7.49% in C2. This significant increase in accuracy loss suggests that this second dataset is less robust than the first. When comparing Fig. 3d to Figure 3b, the general trend in accuracy is evident. However, Fig. 3d displays notably lower accuracy when dealing with what was initially the minority class. Despite the considerable accuracy drop, BERT outperforms the other models once again, strengthening the argument that it is the overall best model.
Examining the cross-dataset evaluation results depicted in Fig. 3e and Fig. 3f, we observe an interesting aspect in the results of C5 and C6. Models trained on the CoAID dataset performed poorly on the C19-Rumor dataset (Fig. 3e). Conversely, the best model trained on the C19-Rumor dataset excelled when tested on the CoAID dataset (Fig. 3f). This phenomenon suggests that the C19-Rumor dataset effectively represents the characteristics of the CoAID dataset, but the reverse is not necessarily true. This relationship is also partly reflected in the word cloud analysis presented in Fig. 1.
In C7, we consistently observe a high level of accuracy, reaffirming the primary objective of this configuration. This objective, centered around testing the models’ ability to handle an expanded dataset covering various subcategories, has been convincingly validated. Once again, BERT outperforms the other models in terms of accuracy, as evident in Table II. Fig. 3g illustrates a minimal number of misclassified inputs. The significant advantage of witnessing C7 perform exceptionally well lies in its confirmation that any marginal reduction in accuracy can be attributed to the models’ enhanced comprehension of the broader subject of COVID-19. This heightened understanding is a direct result of the merged dataset, which thoughtfully addresses issues like class distribution imbalances, topic coverage limitations, and data collection biases present in individual datasets. As a result, the merged dataset naturally enriches the pool of COVID-19-related data, ultimately fostering the accuracy and effectiveness of fake news detection systems.

B. Web Application Evaluation
Fig. 4 demonstrates a real-time use of our web application, encompassing the article content and highlighting the specific line within that article that is undergoing classification. Notably, there is currently no similar application except for CoVerifi [12], which necessitates copying the text and leaving the active page or site to generate a response. In contrast, our tool offers a straightforward highlight-and-click function, eliminating the need for copying or additional buttons to produce results, as required by tools that redirect to external pages. Furthermore, our tool grants users the flexibility to select any text they desire, providing complete control over the application’s inputs.

