This paper is available on arxiv under CC BY 4.0 DEED license.
Authors:
(1) Ehsan Toreini, University of Surrey, UK;
(2) Maryam Mehrnezhad, Royal Holloway University of London;
(3) Aad Van Moorsel, Birmingham University.
Table of Links
Implementation and Performance Analysis
4 Implementation and Performance Analysis
4.1 Proof-of-Concept Implementation
Tools and Platform: The back–end is implemented in Python v3.7.1 and the front–end is implemented with Node.js v10.15.3. In our evaluations, the computations required for generation of the cryptogram table (in the ML system) is developed with Python. The elliptic curve operations make use of the Python package tinyec and the conversion of Python classes to a JSON compatible format uses the Python package JSONpickle. All the experiments are conducted on a MacBook pro laptop with the following configurations: CPU 2.7 GHz Quad-Core Intel Core i7 with 16 GB Memory running MacOS Catalina v.10.15.5 for the Operating System
Case-Study Dataset: We use a publicly available dataset from Medical Expenditure Panel Survey (MEPS) [21] that contains 15830 data points about the healthcare utilization of individuals. We developed a model (Logistic Regression) that determines whether a specific patient requires health services, such as additional care. This ML system assigns a score to each patient. If the score is above a preset threshold, then the patient requires extra health services. In the MEPS dataset, the protected attribute is “race”. A fair system provide
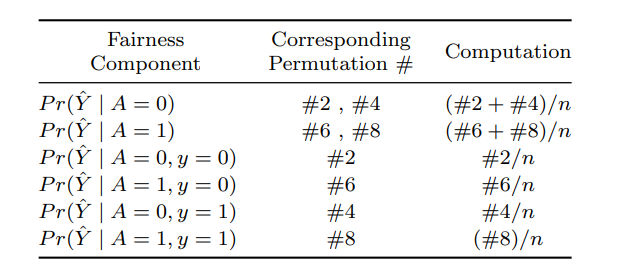
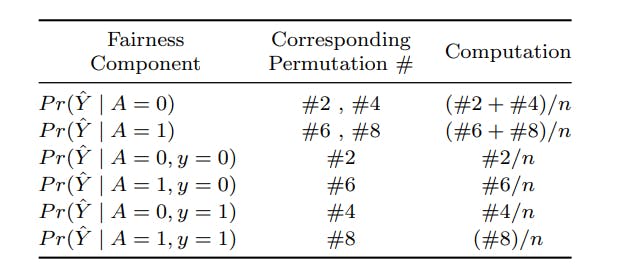
Table 4: The required permutations to compute the fairness metrics of an ML system

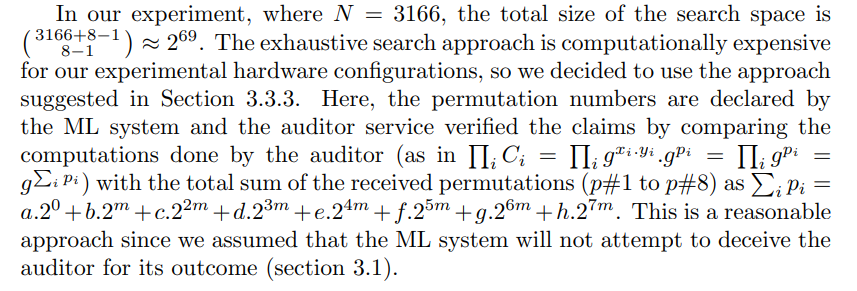
such services fairly independent of the patient’s race. Here, the privileged race group in this dataset is “white ethnicity”. We have used 50% of the dataset as training, 30% as validation and the remaining 20% as test dataset. We set the number of cryptogram table samples to equal the size of test set (N = 3166). In this example we include three attributes in the cryptogram to represent the binary values of A, Y and Yˆ (section 2.1), thus leading to 8 permutations for each data sample.

4.2 Performance
This section presents the execution time per data point for each of the main computational tasks, in each protocol stage. Recall that phase I was executed before the ML system’s training and testing. This stage can be developed (and stored separately) in parallel to the implementation of the model in order to mitigate the performance challenge of Phase I. In our implementation, the output of this stage (cryptogram table) is stored in a separate file in JSON format and can be retrieved at the beginning of the phase II
Phase II begins after the ML model is trained, tested, and validated. This stage uses the output of the ML model to generate the fairness auditing table from the cryptogram table as well as ZKP for knowledge of the permutation. The output of this phase is transmitted to the Fairness Auditor Service in JSON format for phase III. At this stage, first the ZKPs are verified and then, the summation of the cryptograms determines the number of permutations for each of the sensitive groups. Once the auditing service has these numbers, it can compute the fairness of the ML system
In our evaluations (where N = 3166), public/private key pair generation completes in 60 milliseconds (ms) on average with standard deviation of 6ms. The execution time for ZKP of private key was roughly the same (60ms on average with standard deviation of 6ms). The generation of reconstructed public key took around 450ms with standard deviation of 8ms. The most computationally expensive stage in phase I was the 1–out–of–8 ZKP for each of the permutations. This stage took longer than the other ones because first, the algorithm is more complicated and second, it should be repeated 8 times (for each of the permutations separately) for every row in cryptogram table. The computation of 1–out–of–8 ZKPs takes 1.7 seconds for each data sample with STD of 0.1 seconds. Overall, phase I took around 14 seconds with STD of 1 second for each data sample in the test set. In our experiments (where N = 3166 samples), the total execution of phase I took roughly 12 hours and 54 minutes.
Phase II consists of creation of the auditing table and generation of the ZKP for knowledge of the permutation. The fairness auditing table is derived from the cryptogram table (as it is mapping the encoding to the corresponding permutation number in the cryptogram table). The elapsed time for such derivation is negligible (total: 1ms). The generation of ZKP for knowledge of the permutation executed less than 60ms on average with standard deviation of 3ms for each data sample. The completion of both stages took less than 3 minutes. The fairness auditing table is sent to the Fairness Auditor Service for Phase III.
The verification of ZKPs in the last phase (Phase III) is a computationally expensive operation. The ZKP for the ownership of the private key took around 260ms on average with standard deviation of 2ms. The verification of 1–out– of–8 ZKP for each data point roughly took 2.5 seconds on average with 20ms standard deviation. The verification of the ZKP for knowledge of permutation executed in 100ms with standard deviation of 5ms. The summation of the cryptograms after verification took 450ms overall for N = 3166 items. In our experiment, completion of the stages in phase III took around 2 hours and 30 minutes in total.
In summary, the experimental setup for our architecture, where we computed the required cryptograms and ZKPs for N = 3166 data points in a real–world dataset, overall time was around 15 hours on the laptop specification given earlier. The main part of the time is consumed by the computation required for phase I (12 hours and 54 minutes). However, as we noted before, Phase I can be executed before the ML model setup and is stored in a separate JSON file and will be loaded at the beginning of stage II (after the training and validation of the ML model is complete). The other main computational effort, which can only be done after the ML system’s outcomes have been obtained, is in Phase III. For our example, actual computation of fairness takes two and a half hours. In summary, the creation and handling of cryptograms takes considerable computational effort for realistic datasets and for the fairness metrics that require three attributes. In what follows we analyse how performance scales with respect to the number of data points as well as with the number of attributes represented in the cryptograms.

